


 310
310 Like
Like Share
Share
 Report
Author Note
All content, including samples, images and writings can be found in my GitHub repo.
This specific article appears here.
Revisions
02/12/2023 - Fixed images, updated titles.
Summary
Power Apps Canvas Apps represent a no or low code approach to building and delivering modern applications for makers. The requirements of knowing programming languages such as C# have been removed allowing makers of virtually any background to build apps. These apps can be used with hundreds of connectors allowing for a flexible user interface layered on top of data sources. Apps can also be generated from data sources automatically allowing you to quickly create and deploy an application to your team or customers.
This article is designed to introduce designers and analysts to the Monitoring Tool within Canvas Apps. In this article, we will discuss how to get started using the tool, interacting with the tool and exploring data returned within the tool. Finally, we will discuss archiving and sharing session data for further analysis.
Opening the Monitoring Tool
In my experience building a canvas application, I ran into a very useful feature in the Experimental tab called the Monitoring tool. The tool captures user interactions with controls as well as calls to connectors and Power Automate operations. Let's look into how to open the tool and dig into the different entries.
Author's Note: Click on each image for additional clarity.
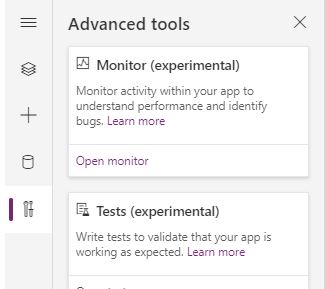
Open the Monitoring Tool by going to the Advanced pane in the left hand side of the Canvas App maker portal. Clicking the link will open a new tab and launch the Monitoring tool. From here it will capture user actions and network calls. Alternatively the monitoring entries can be downloaded or a previous session can be uploaded for review.
Using the Monitoring Tool
Columns Listed
The Monitoring Tool, when opened, presents a list of columns to help summarize each action performed in the Canvas App when designing. Each action or event is provided an ID, the time it happened (down to the millisecond) and depending what type of action (Integration, User Click, etc) various other data points.
Using the Category column, you can see what type of action was performed.
![]()
The tool offers a handy filter box that allows us to filter down to specifics such as operation or category types. This comes in handy where you may have hundreds of events to search through.

Also within the columns is the DataSource and Control that invoked the action. This is helpful to see what action a user may have taken that made an external call and what frequency. Using this data, considerations for caching or restricting calls can be made.
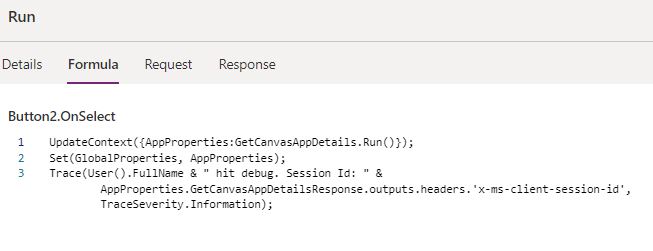
Finally, each action contains data that can be reviewed. For text boxes this may simply be what users are typing. For integrations this will include the HTTP request and response, helpful for debugging data formats as discussed later. This column also includes the Formula within in the control which shows what input properties are being used. This can help support engineers deliver feedback to developers that expected inputs or outputs are not being handled properly.
Reviewing User Actions within Canvas Apps
Each keystroke is captured as a UserAction entry. Wait time and data input between keystrokes are captured allowing analysts to determine when and how another event may have been invoked, global variable set, etc.
Each monitor entry includes a unique id called a uuid, the time of the entry, the operation, the control type and name and the data collected. The image below shows a calendar control with the value input.
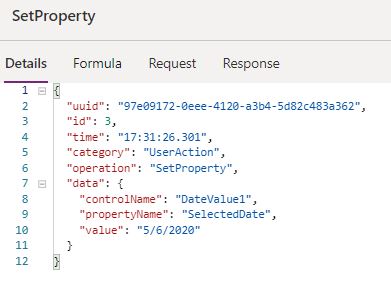
In a recent investigation, I was able to use this property, along with the patch operation, to better understand why the date selected by the user was not matching to the connected data source.
Reviewing Connection and Power Automate Operations
The ability to capture and investigate Connection and Power Automate integration requests and responses is where, in my opinion, the monitoring tool really begins to prove how essential of a tool it is for a developer. Each request and response made to a first class connector or custom connector is captured as a Network entry.
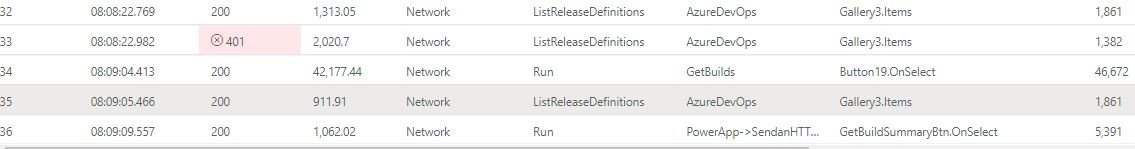
As shown above, a developer can view the HTTP status, the duration, which operation and data source was used, as well as which control property invoked the action for all calls made to Power Automate. This view allows a quick look to first see which calls may have failed and then to dig into the performance and payload size for tuning opportunities.
In my experience using this tool at the beginning of the development of a Power Automate integration will save a significant of work and time spent debugging. Each call is captured allowing us to see not only the headers, which includes the workflow run identifiers, but the response and how it will be delivered to the Canvas Application.
The image below shows, along with duration and payload size, the response headers for a native connection to the Azure DevOps connector for the List release definitions response.
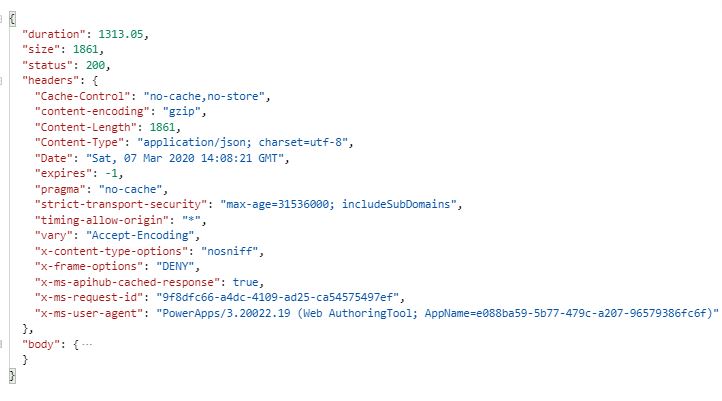
The provided connectors should work as expected but its helpful to review these headers to gain insights into how they work. Where I find value in response headers is when working with either custom connectors or invoking Power Automate flows from Canvas Apps.
The image below is from a custom connector built using an Azure Function. As shown, the "x-ms-client-request-id" header is passed back but this can be expanded depending on the function output.
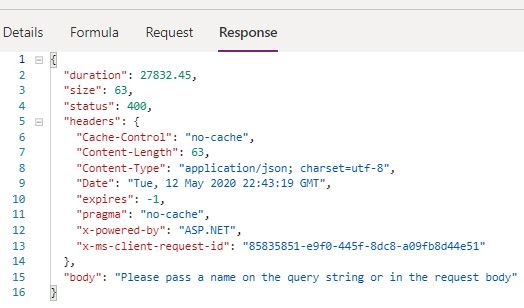
Depending on the value or control, the data needs to be consumable or else it cannot be rendered correctly. This tends to come up when working with tables or galleries within Canvas Apps that expect a flattened table, meaning columns that include complex objects or even array objects returned have some trouble.
I ran into this scenario when working with the Send an HTTP request to Azure DevOps action within the Azure DevOps connector specifically. Depending on REST API call used, various responses would be returned with objects containing objects and so on. While the connector provides the ability to use this action, I recommend writing a Power Automate flow and using the response JSON tree in the Monitoring Tool to help flatten the response.
NOTE: Canvas App tables and data sets work best with strongly typed flattened datasets.
The image below shows a technique I used to assist with working with the Azure DevOps action.
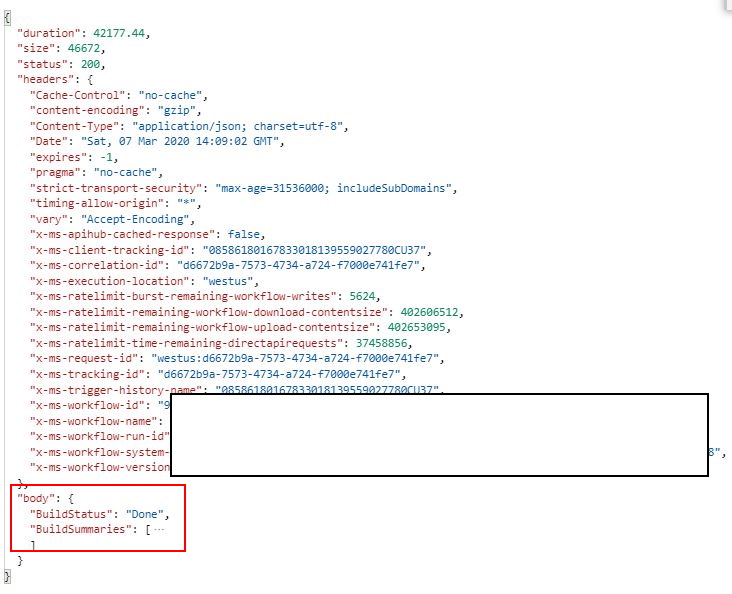
This image also shows very important headers we will discuss further in an article detailing the connectors between Power Apps Canvas Apps and Power Automate.
Reporting and Archiving Monitoring Tool Sessions
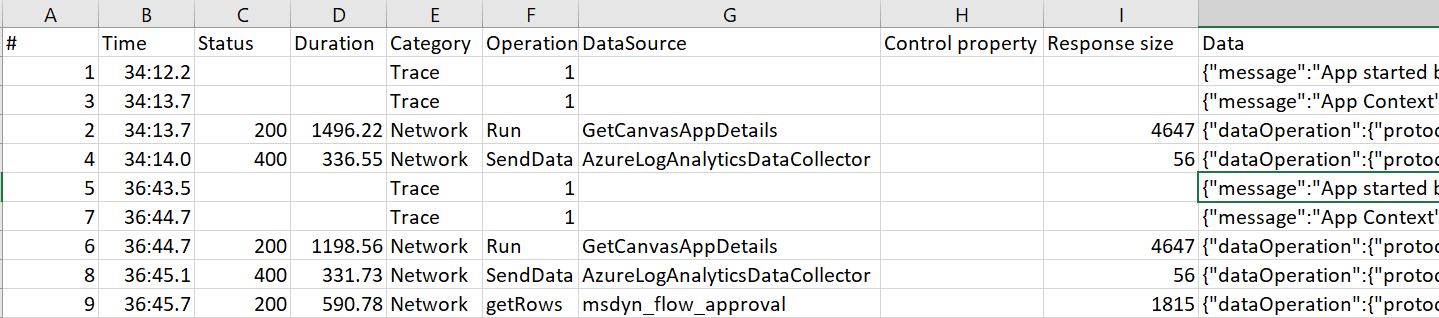
Export and Import
The Monitoring tool allows developers and makers to export the captured events to a CSV or JSON file. This can assist with troubleshooting connection issues, performance issues or simply to archive events for analysts. The file includes the request and response payload found in the online tool as well as the default columns. . The exported file can also be imported back into tool for a detailed breakdown.
Reporting
Microsoft Power BI provides data connectors for CSV and JSON files. With this connector, Power BI authors can take exported monitoring tool sessions and build visualizations allowing analysts to drill down into specifics.
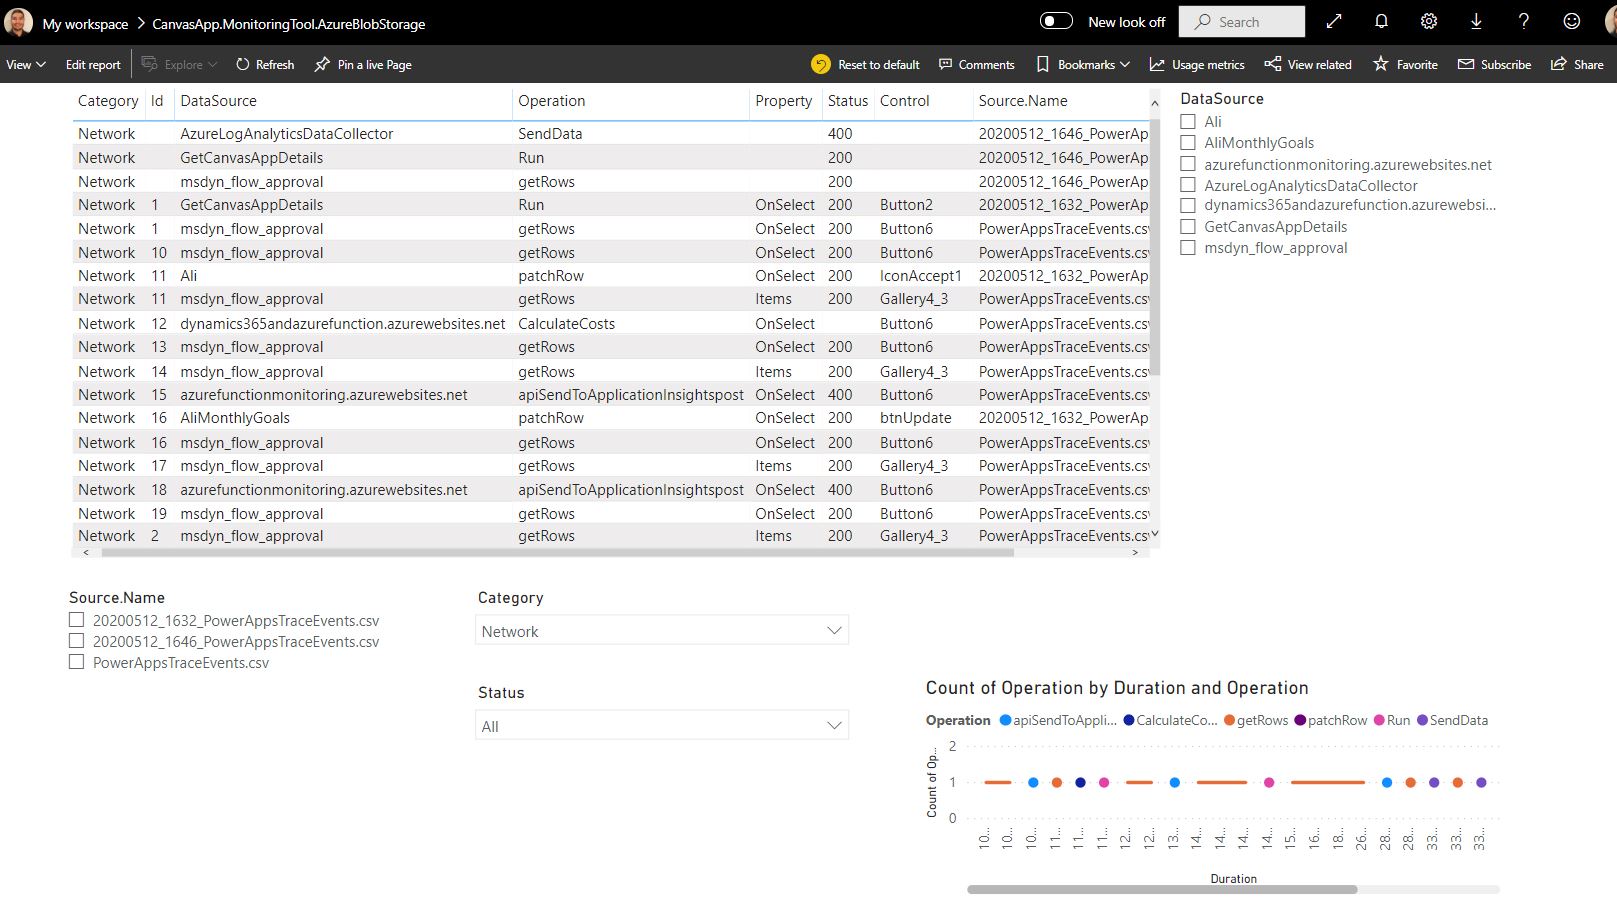
Archiving
Another neat feature of Microsoft Power BI is the ability to connect to a Azure Blob Storage container. Once connected, Power BI can combine files into a single query which can be used within a report. This technique will allow us to upload the session directly to a container and have this instantly be part of the Power BI dashboard.
Next Steps
The native Monitoring Tool is a relatively new feature for Canvas Applications. I highly recommend using the tool as early in the development process as possible to better understand how the application works and where it could be tuned. The Monitoring tool really helped me better understand my integrations and how to work within the expected data delivered back to Canvas App objects.
If you are interested in learning more about specialized guidance and training for monitoring or other areas of the Power Platform, which includes a monitoring workshop, please contact your Microsoft representative for further details.
Your feedback is extremely valuable so please leave a comment below and I'll be happy to help where I can! Also, if you find any inconsistencies, omissions or have suggestions, please go here to submit a new issue.
Index
*This post is locked for comments