


 310
310 Like
Like Share
Share
 Report
Summary
Microsoft Power Virtual Agents provide Makers the ability to create virtual assistances and agents to help customers and employees. An authoring canvas guides makers through the process of building and publishing bots without the need of developing with the Microsoft Bot Framework. This removes the barriers of entry, allowing designers and Makers to focus on rich meaningful conversations.
This article will focus on Power Virtual Agent Analytics and how to review the metrics from user sessions and conversations to work towards increased customer satisfaction and user productivity.
The Case for Power Virtual Agents
A common theme I've heard when talking about bots revolve around their usefulness and the idea that they could possibly replace some jobs. According to Gartner by 2020, AI will generate 2.3 million jobs and by 2025 net new jobs will reach 2 million. NOTE: This link is to an article reporting on the report.
This Gartner report showcases some of the uses for chatbot in the enterprise and is worth checking out.
With Microsoft Power Virtual Agents, you can:
- Empower your teams by allowing them to easily build bots themselves without needing intermediaries, or coding or AI expertise.
- Reduce costs by easily automating common inquiries and freeing human agent time to deal with more complex issues.
- Improve customer satisfaction by allowing customers to self-help and resolve issues quickly 24/7 using rich personalized bot conversations.
As with other pillars of the Power Platform, Power Virtual Agents represent a no code solution to virtual assistants. These assistants can be completely authored within the Virtual Agent Authoring Canvas without the need of Bot Framework experience. If an integration is needed, say for use with Cognitive Services, Microsoft Power Automate can be invoked natively from a topic. This allows the bot authors to focus on how to drive the conversation towards a resolution to better serve an organization's customers and provide employees assistance with tasks.
Power Virtual Agent Analytics
Power Virtual Agent Analytics in the Virtual Agent Home Page
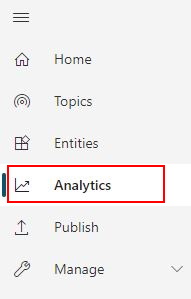
Navigating the Portal
With the appropriate licensing, an analyst can navigate to https://powerva.microsoft.com which will land you on the Home Page. From there, you can navigate to the Analytics dashboard.
What to look for: Engagements, Sessions and Satisfaction
When I began my research into the Power Virtual Agent Analytics feature I was drawn to a statement I heard from Michael Vakoc, Program Manager for Power Virtual Agents, regarding what I should be looking to continuously improve my bot. Understanding resolution metrics and how we can work to increase this key performance indicator should be the driver of optimization. Resolution means, did my bot successfully deliver information, answer a question or overall provide satisfaction to its user. This can be drilled down to a single imperative question to the user:
Did the bot HELP solve a problem?
Expanding Engagement
Each time a bot user begins interacting with the Power Virtual Agent a session is created. Upon initiation, the bot will search through its catalog or conversational topics to find the appropriate topic to engage with the user. Success is driven on the match of the user ask and the topic created by designers.
As analysts we will work with the reports and data to identify where the bot was not able to successfully link a user ask or problem with a topic. This is called expanding the engagement of bots and it is a major KPI for how well your bot is performing.
Analyzing Engagement and Session Outcomes
Power Virtual Agent Analytics provides us a great way to see how we can increase resolution by providing metrics on Abandonment and Escalation. Each session offers analysts these three data points, Resolution, Abandonment and Escalation which can be used by analysts.
Increase Resolution
To understand how we can increase resolution we need to discuss what metrics impact it. A user responding yes to the above question is paramount to what we call resolution, so we have to analyze what may drive a user to respond no. A great article to review when designing your bot is aptly titled Principals of bot design. The key pillars that drive successful resolution include:
- Does the bot easily solve the user’s problem with the minimum number of steps?
- Does the bot solve the user’s problem better/easier/faster than any of the alternative experiences?
- Does the bot run on the devices and platforms the user cares about?
- Is the bot discoverable? Do the users naturally know what to do when using it?
Ultimately, our goal as designers is to attempt to solve the above questions, working with the analytics provided to address our bots gaps or inefficiencies to help and empower our users.
Decrease Abandonment and Escalation
Abandonment typically means that a user left a session open or did not complete the session as expected. This could represent actions like leaving shopping carts open without purchasing, hanging up or navigating away or simply leaving for an extended period of time. For Power Virtual Agents, abandonment per this deep dive is calculated as non interaction after a 30 minutes to one hour time period. Abandonment metrics can point to a topic or engagement that needs to be looked at. Further in the article we will explore charts and session details which can help find where a user may become disengaged and abandon the session.
Escalation on the other hand represents a negative impact to our resolution metric. Its important to point out here that while this number does negatively impact resolution, its not an indicator that the bot did not do its job as intended. Some questions or issues are too complex and need to be transferred to a live person. This transfer would be represented as an escalation in the Power Virtual Agents Analytics charts. What would be helpful for an analyst is to review the escalations, along with conversations and feedback from the agent who the bot handed off to. Combining the session data and human agent feedback, we can analyze and suggest to authors where a topic could be enhanced to help triage.
Power Virtual Agent Reports
Summary
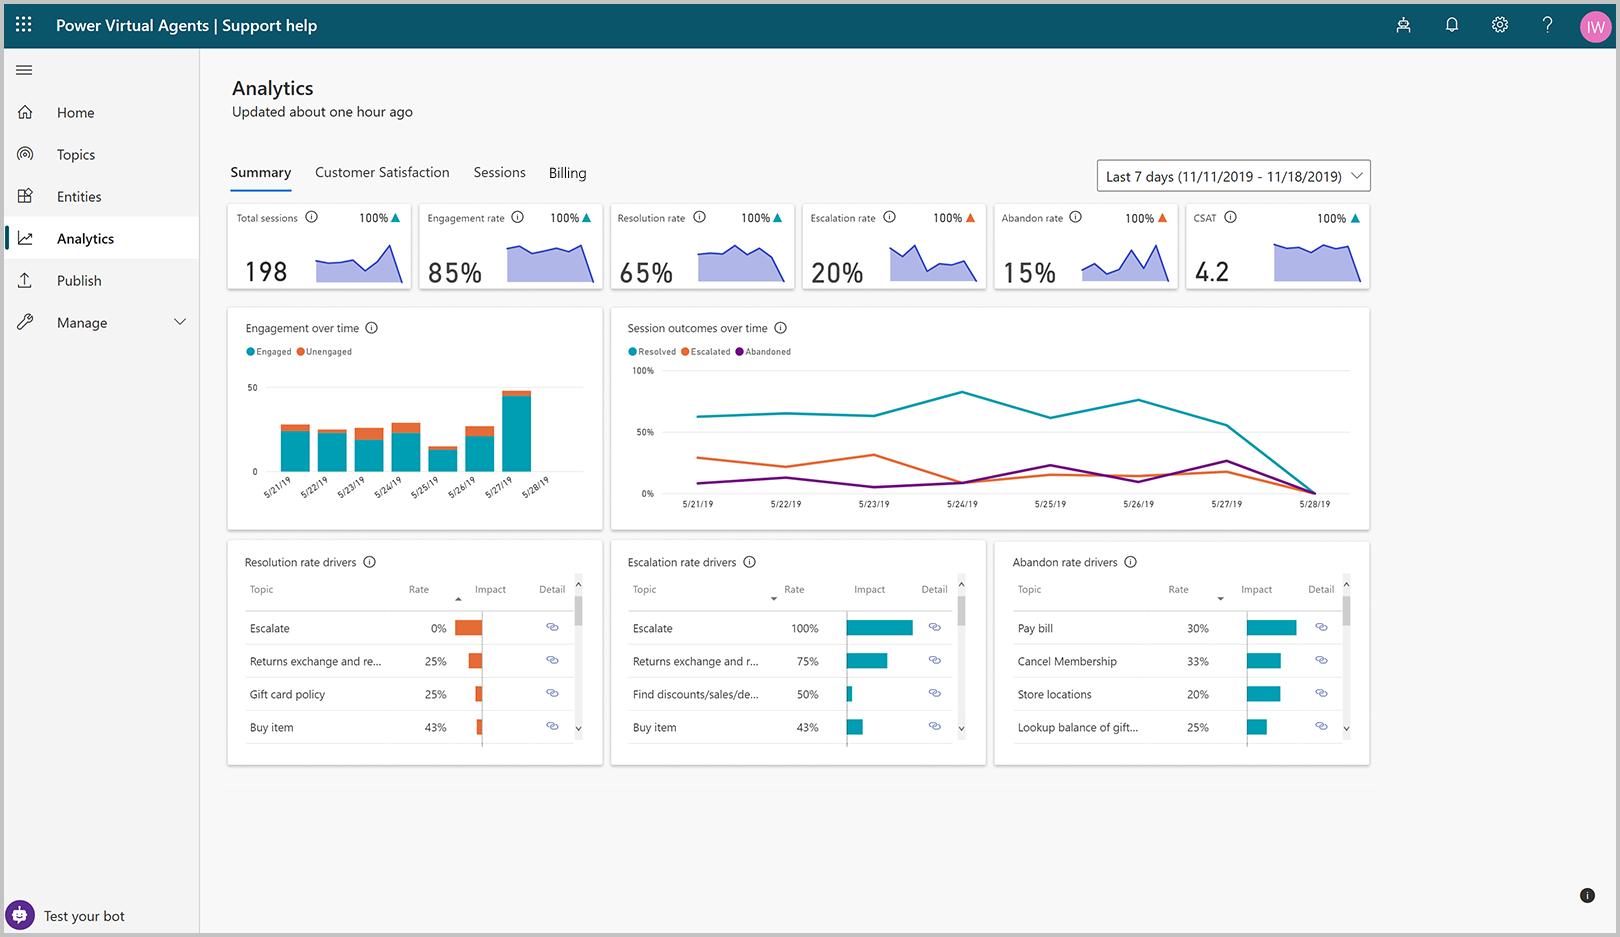
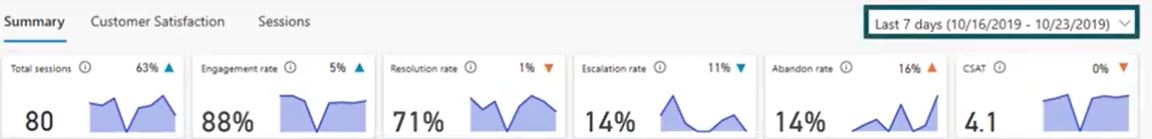
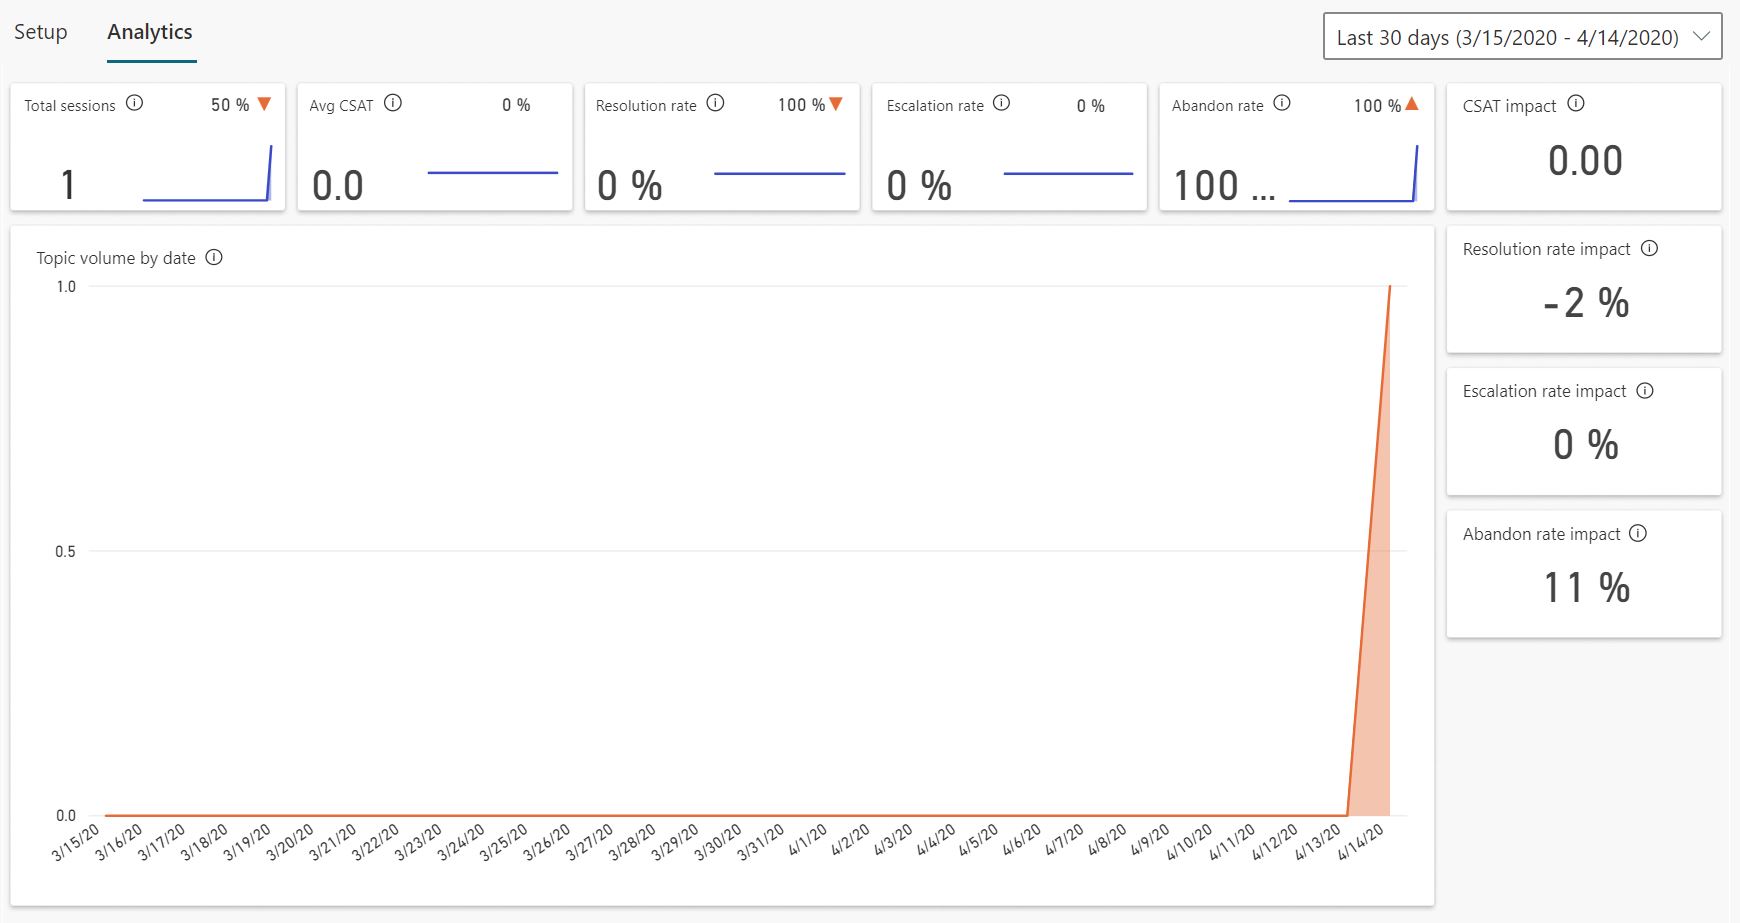
Key Performance Indicators
At the top of the Summary report are Key Performance Indicators showing the number of sessions, the engagement rate and the outcomes. Included as well is the customer satisfaction (CSAT) percentage. Each of the KPIs includes a percentage showing the trend over the given time frame. This area is useful to visualize the overall analytics for your specific bot.
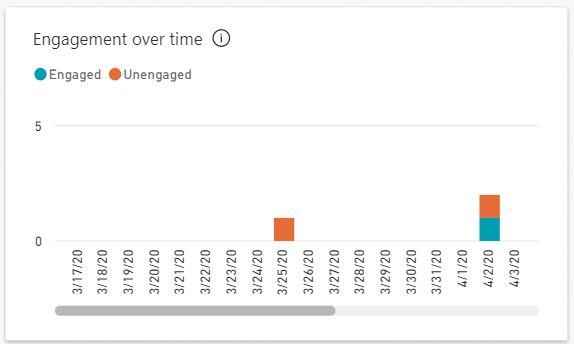
Engagement over time
An engaged session represents a session in which a specific user created or escalation topic was triggered. This is helpful to understand topic gaps that can be addressed by authors.
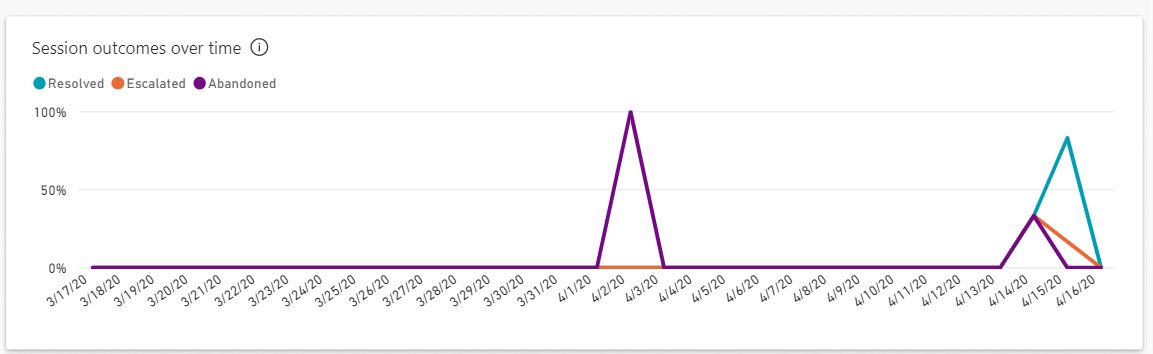
Session outcomes
As described above, session outcomes help us understand if a bot helped answer the imperative question. We tend to want to see the resolution rate in the KPI increasing and if its not this chart can help. The chart shows session outcomes over a period of time so we can begin to see downward trends.
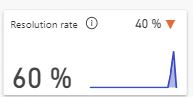
Resolution Rate KPI and Drivers
The Resolution KPI in the header includes the percentage and the trend during our selected time frame.
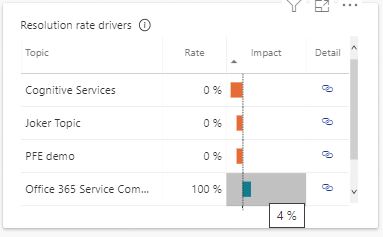
The Resolution rate drivers chart is useful for admins to see which topics are successfully resolved at what rate percentage. Hovering over each topic, an admin can see the impact on the overall resolution rate. Higher impact means this topic represents something useful for users and could be a foundation for other topics.
A red bar represents negative impact while a blue bar represents positive. The length is the amount of impact. Within this chart an admin can drill down to a specific topic by clicking the Detail link which will route to the Topic Analytics report.
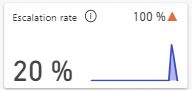
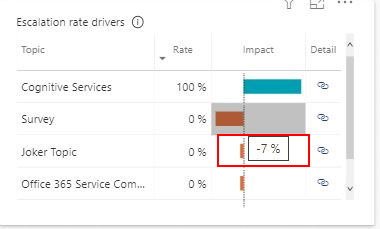
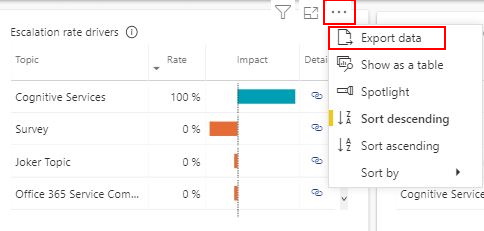
Escalation Rate KPI and Drivers
The Escalation KPI in the header includes the percentage and the trend during our selected time frame.
The Escalation rate drivers chart is useful for admins to see which topics are being abandoned at what rate percentage. Hovering over each topic, an admin can see the impact on the overall resolution rate. Higher impact means this topic represents an increase in a handoff to a live agent. As stated above, due to the complex nature of some questions or issues this doesn't necessarily represent a bad thing. However this is a great chart to begin drilling into to find conversation points with the live agent to ensure the bot is providing usefulness.
A red bar represents negative impact while a blue bar represents positive. The length is the amount of impact. Within this chart an admin can drill down to a specific topic by clicking the Detail link which will route to the Topic Analytics report.
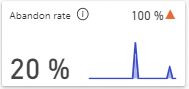
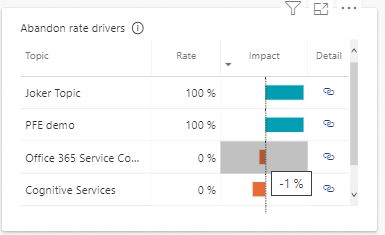
Abandon Rate KPI and Drivers
The Abandon KPI in the header includes the percentage and the trend during our selected time frame.
The Abandon rate drivers chart is useful for admins to see which topics are being abandoned at what rate percentage. Hovering over each topic, an admin can see the impact on the overall resolution rate. Higher impact means this topic represents a clear metric for improvement and could be used for other topic improvements. Reviewing the conversational data for these topics, analysts can investigate where a user may have lost interest and how to keep them engaged.
A red bar represents negative impact while a blue bar represents positive. The length is the amount of impact. Within this chart an admin can drill down to a specific topic by clicking the Detail link which will route to the Topic Analytics report.
Customer Satisfaction
Customer satisfaction leads to increased usage of our bot and this report help identify which topics are having the most impact in this area. The Customer Satisfaction report is where analysts will go to stay informed in this area. Topics with a high CSAT impact are great but look to couple this with the number of engaged sessions. In the deep dive its suggested to sort by the highest engaged sessions and starting there as they represent the most popular sessions. Review the CSAT impact of this topic as well as the outcome KPIs.
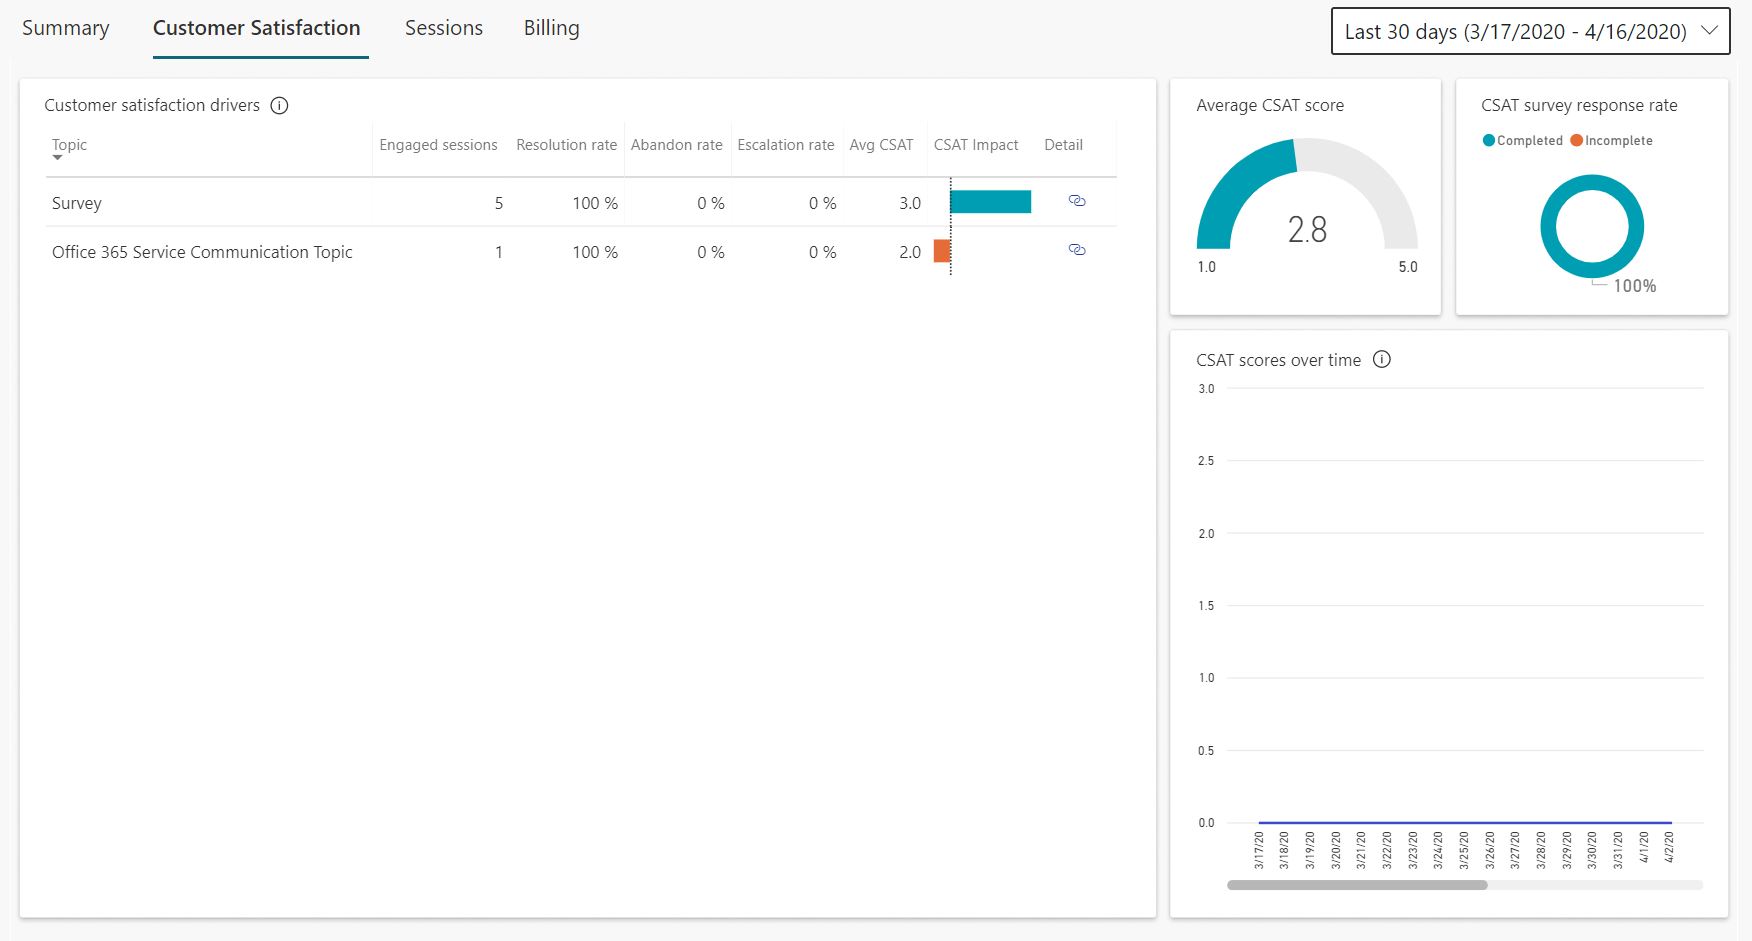
The Average CSAT Score is a great way to see how customer satisfaction has been trending over past week or month.
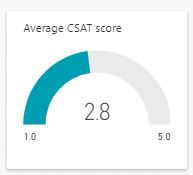
This metric goes from 1 to 5 and is driven by the customer survey at the end of the session (e.g. the smiling faces). Obviously I have some work to do with bot as it only scored a 2.8!
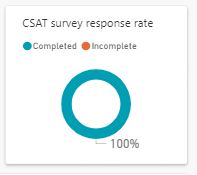
The CSAT survey response rate over time can help analysts visualize completed and incomplete surveys.
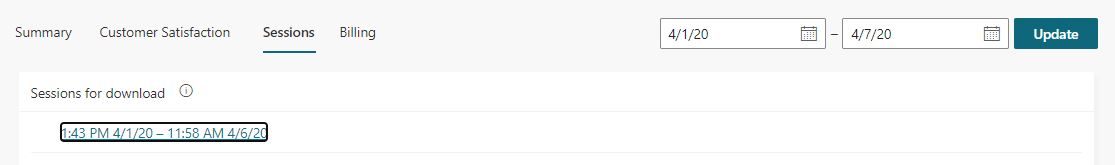
Session Information
The Sessions report allows admins the ability to review and monitor how sessions are doing, including the topic, transcript and outcome. The session picker currently let's admins pick from sessions within a given week.
When opening the spreadsheet the following columns are available: Start Time, Initial User Message, Topic Name and Id, the Chat Transcript and the eventual Session Outcome. I'll dig deeper into the transcript in a following article, keep in mind this includes the dialog in the session and both the user and bot responses.
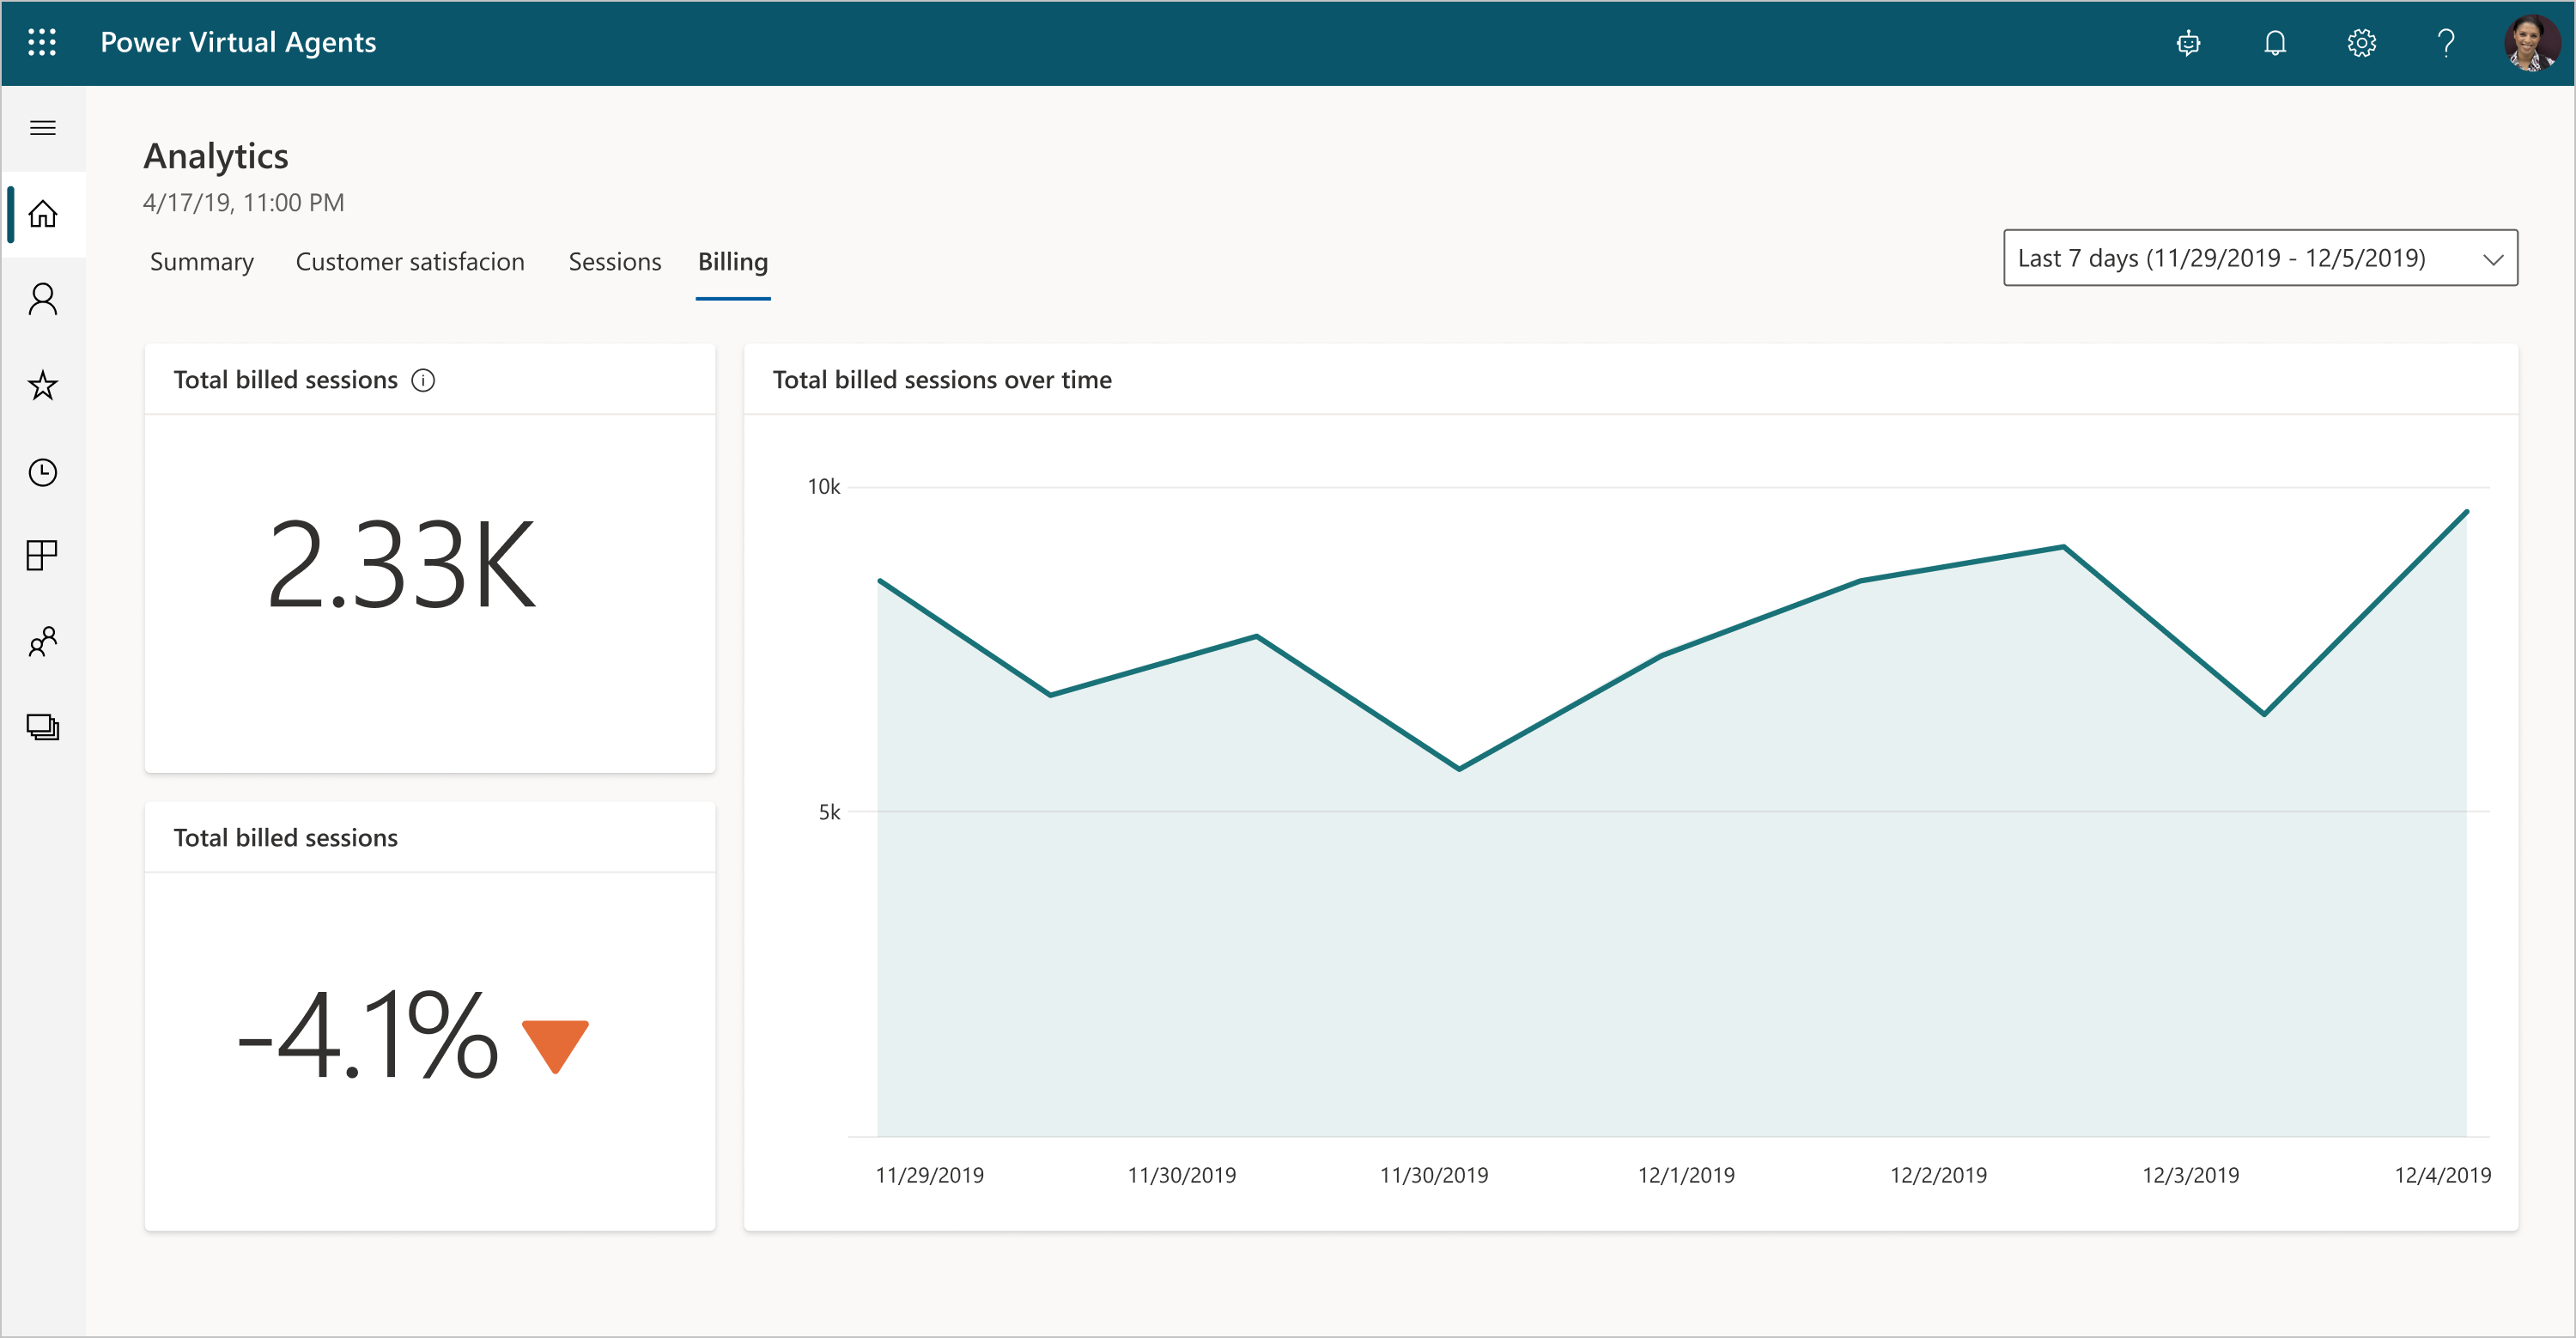
Billed Sessions
The Billing report helps to better understand how sessions are being billed, based on their usage. Using these metrics collected, admins can better forecast how many sessions to purchase going forward based on historical trends.
Topic Analytics Report
Each topic contains analytics that can help administrators further drill into impact and outcome metrics. These are shown in the Topic Analytics report. To navigate to these analytics, choose a topic and click the button as shown below.
This report shows how individual topics are doing and how well they're working at resolving issues.
Filtering the data returned
The Power Virtual Agent Analytics will show environments an admin has access to review data for. During session and engagement review, analysts may want to focus on a specific environment and time range. To change this, click the filter located to the upper right on each report.
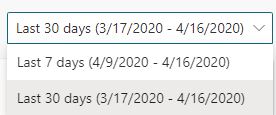
The filter can be set for 7 or 30 days for reports. For sessions, downloadable reports can be filtered weekly within a 30 day window.
Export data for Analysis
Currently the only way to export data from Power Virtual Agent Analytics is by using the ellipsis on the specified report. When prompted click the "Export data" button.
Next Steps
Power Virtual Agent Analytics allow analysts to review conservations and engagements users have with bots. Outcomes are represented as successful resolutions, escalations to live agents, or abandonments. To further analyze each session, use the Session report to download individual sessions. Each session includes the entire conversation, which can be extracted to see how a user responds to a bot's messaging. Follow up questions from a user can be used to enhance the conversation and identify gaps in the topic.
If you are interested in learning more about specialized guidance and training for monitoring or other areas of the Power Platform, which includes a monitoring workshop, please contact your Technical Account Manager or Microsoft representative for further details.
Your feedback is extremely valuable so please leave a comment below and I'll be happy to help where I can! Also, if you find any inconsistencies, omissions or have suggestions, please go here to submit a new issue.
Be sure to subscribe to the official blog from the Power Virtual Agents team to stay up to date on the latest news and offerings!
*This post is locked for comments