Hi Guys,
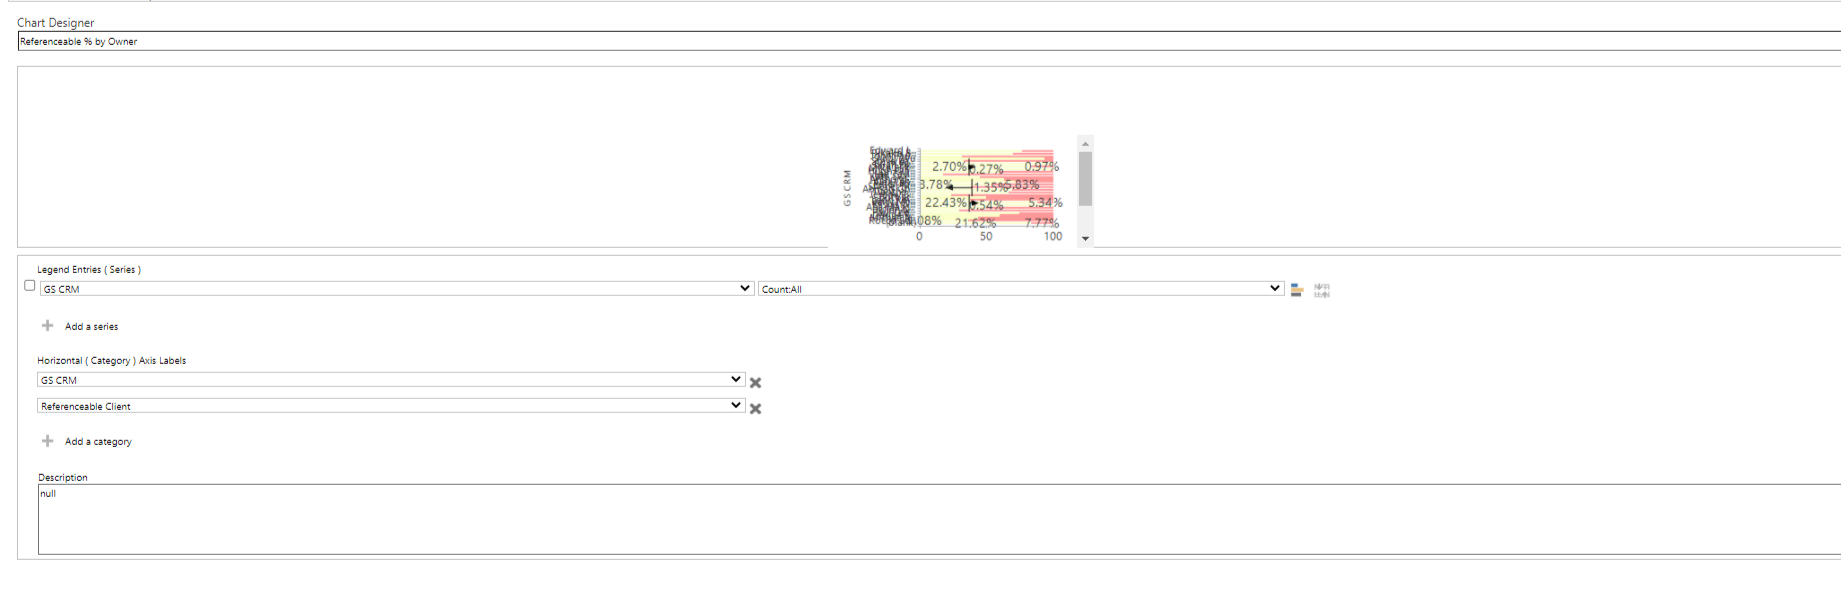
I have a chart below that I want to show the % of referencable clients we have by owner. Im using a bar stacked chart to show each owner, and the % of clients they own as being referencable.
The chart isnt showing exactly as id like, instead of showing the % of clients owned by the individual, it is showing a % of the overall number of clients that the owner has.
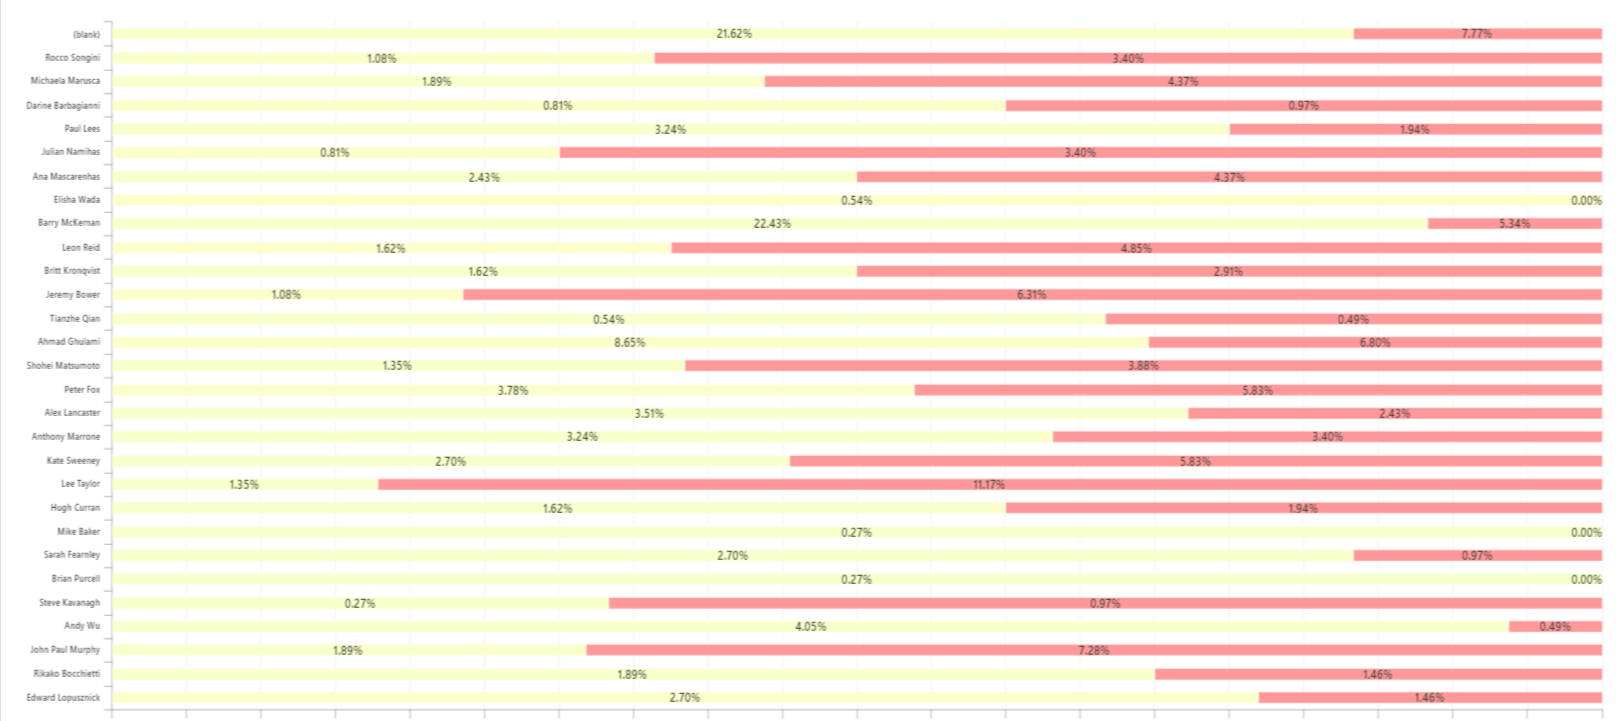
So take Rocco as the example (second from top) he has 1.08% of clients that are not referencable and 3.40% that are. In numbers this is 4 not and 7 that are. So I would like the chart to show a % of those 11 clients owned by Rocco, therefore the chart should read 36% No and 64% yes.
Here is the chart details below.